J David Smith - Project Portfolio

This is a selection of some of the projects I have worked on over the course of my career. It is broken down into three sections: Research, Industry, and Hobby Projects.

Research Projects

Projects done during the course of my PhD work at the University of Florida under Dr. My T. Thai. I studied approximate methods for discrete optimization with a focus on its applications in social networks analysis.

The distribution of Edgecut Weights on a few networks, ranging in size from around 90,000 connections to over 4.5 million.

The shape of these gives insight into network structure. For example: the "elbow" shape of Enron Email indicates a dense core with sparse periphery.

Measuring Community Structure on Social Media

In the study of modern social networks, we work with networks under very restrictive access controls. My goal with this project was to develop a method to measure community structure in an unsupervised fashion that functions despite such limitations.

To accomplish this, I developed a novel method to calculate the local sparsity of a connection on the network, which is closely related to community structure. Using state-of-the-art Monte Carlo estimation methods, my approach is query-efficient enough to run on Twitter in a reasonable timeframe. Further, I developed a scalable, highly-parallel Rust implementation to calculate the distribution of this quantity on very large networks—and explored what this summarization can tell us about the network structure.

Efficient Optimization on the Integer Lattice

Most optimization problems can be divided into two pieces: the constraint system on which you solve, and the function that you optimize under those constraints. Many traditional problems use a simple size constraint paired with a function that has diminishing returns (or, formally, submodularity)—a property that leads to very powerful results for approximate optimization.

We developed an algorithm to optimize a much broader class of functions on a more powerful constraint system known as the integer lattice. I built an efficient Rust implementation of our method, which we used to show that our approach is faster than prior work both in a holistic sense and in terms of query requirements—without a drop in solution quality.

The Query complexity, which represents the number of expensive queries we need to run, as a function of problem size.

Three algorithms are shown: Fast- (our primary contribution), Threshold-, and Standard-Greedy.
The solution quality for the same set of runs, showing that our algorithm (Fast-Greedy) does not sacrifice solution quality—despite a twenty-fold reduction in query count.
The runtime complexity as a function of the approximation guarantee provided by each algorithm. TipTop is our approach. The dotted lines indicate two standard theoretical guarantees: 1 - 1/e (63%) and 1 - 1/√e (39%).

Our algorithm is the first to be able to provide a guarantee greater than 63% for this problem. Due to our low sampling complexity, we are able to provide a 90% guarantee in less time than some prior work could provide a 63% guarantee.
Solution quality, represented as a fraction of the optimal solution. The green line (TipTop; our algorithm) provides a solution that is at least 98% optimal here, which allows us to place a tight estimate on the true optimal value for the first time.

The remaining algorithms decay down to their guarantees (a bit below 63%) as the problem size grows.

Optimizing Information Spread

One of the core functions of social networks is to spread information. It is natural, then, to ask how we can maximize such spread. Unfortunately, even evaluating the expected spread is very difficult—it is in class #P and requires exponential time to do exactly. Nonetheless, in this project we developed an efficient, approximately optimal algorithm to solve this problem.

We used a sampling-based approach to estimate the optimization surface efficiently. In fact, the number of samples required ended up being so low that we switched from the traditional greedy algorithm to an Integer Programming approach to improve our approximation guarantee to be at least 1 - ε times the optimal. I built the implementation we used from this: first in C++ with library code from previous projects, and subsequently a full rewrite in Rust along with safe wrappers for the C APIs of the CPLEX and Gurobi solvers to make the implementation obviously correct.
Industry Projects

Now-public projects done during my time as an intern at IBM in Summer 2014 and 2015.

Dataflow Maps for Vulnerability Mitigation

In software engineering, the task of finding and effectively fixing security vulnerabilities is daunting—especially in a codebase with hundreds of thousands or millions of lines of code. Many classes of vulnerabilities are caused by malicious input flowing to unintended parts of the software, making code analysis a powerful tool for identifying possible vulnerabilities.

However, even having a list of vulnerabilities constructed automatically still leaves the developer with the task of finding an appropriate fix location. At IBM, I built an interactive visualization tool for the AppScan Source static code analysis product. Developers could explore the map, using it to identify points where one fix could address multiple vulnerabilities in a single change.

A small sample of a dataflow map, modelled after the Tube Map of the London Underground subway system.

Each station represents a function or method, with the colored wings indicating the kinds of vulnerabilities that may be addressed by applying a fix at that point. The lines show flow of data from one method to another: fixing a vulnerability at one station fixes it for all downstream stations.

In the interactive version, stations were linked to the code. Additionally, the visualization could be filtered by scope, vulnerability type, and vulnerability count to allow developers to effectively triage their codebase.

Traffic Management for Cloud Applications

IBM has a network traffic management appliance (DataPower) that has historically been focused on use in enterprise networks. As part of their cloud push, they wanted to expand this to include use on their platform-as-a-service offering. My team designed a developed a proof-of-concept system that exposed the full power of the appliance to users of the IBM Cloud (called Bluemix at the time).

A key challenge we faced was the single-tenant design of the DataPower appliance: it assumed that anyone with write-access could define a policy to manage any traffic, which does not match the situation in a multi-tenant cloud system. To address this, we designed a traffic policy description JSON schema that allowed users to define policies that only affected their own application while maintaining most of the power and flexibility of the underlying hardware.

We built a user-friendly cloud interface (running Angular.js on the front-end and Node.js on the back-end) for querying traffic patterns from ElasticSearch , checking policies against that traffic pre-deployment, and subsequently deploying those policies to the appliance. This proof-of-concept was deployed to one of the cloud datacenters for demonstration, and parts were later incorporated into the DataPower product under the hood.

Hobby Projects

Projects done for personal enjoyment, or to solve problems in the communities I am involved in.

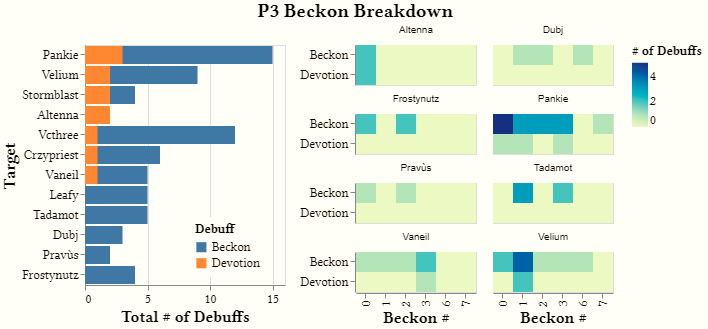
A sample visualization generated using this tool from our progression on Queen Azshara, showing the breakdown of "Beckon" casts—if not handled correctly, these result in the targeted player becoming mind-controlled ("Devotion").

The left figure plots the number of times each player was targeted, along with the number of times they failed the mechanic. The right figure breaks it down by the different stages of the fight. A more complete perspective of what this dashboard looks like can be seen here. This shows every metric that I'd been looking at on this fight and our performance on it on the night we defeated Queen Azshara.

Warcraft Logs Visualization Dashboard

As an officer for Occasional Excellence's Weekend raid team in World of Warcraft, one of my responsibilities is to review combat logs mid- and post-raid to identify issues hindering our progress and propose solutions. On longer bosses like Queen Azshara or N'zoth, the Corruptor, these can become tedious as the same queries are often repeated over many nights of progression.

To address this, I built a visualization platform in TypeScript to perform two functions: display aggregated results over an entire night of progression (something that WarcraftLogs does poorly), and save and repeat queries automatically on future nights.

Visualizations are written on the client in a grammar of graphics via the Vega-Lite library, allowing me to iterate quickly and identify macro problems in our raid performance. This also allows them to be shared with other users, though at this time I only know of one other person using this tool.

WoWAnalyzer

One of the challenges in learning to play World of Warcraft is how opaque the causes of your success and failure in-game can be. WoWAnalyzer helps address this by breaking down a player's performance, grading them on a number of metrics and providing concrete suggestions for improvement.

I maintain the Brewmaster Monk and Protection Paladin analysis code, along with many of our testing tools. My goal has been to provide two main pieces of analysis: introductory-level evaluation of performance suitable for new players, and detailed evaluations of item, trinket and talent values suitable for advanced players.

The Brewmaster analysis has been my focus for much of my time helping on WoWAnalyzer. I've implemented a number of advanced features to support my goals. For example: instead of a fixed threshold for defensive ability use that may be wildly incorrect on some encounters, my code automatically determines the appropriate threshold based on time-varying player stats and random effects that are outside of player control.

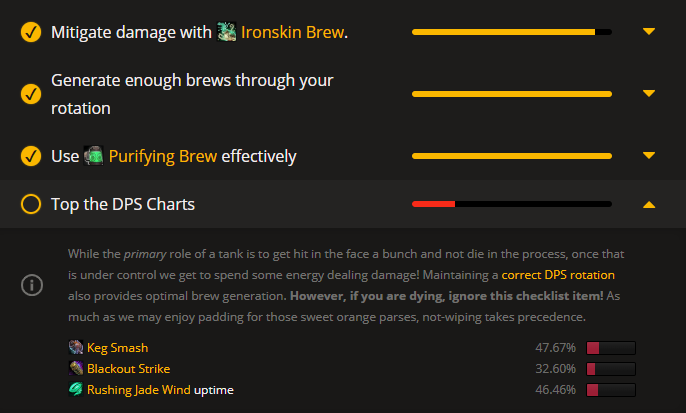
A sample checklist from the Brewmaster analysis on WoWAnalyzer The checklist is aimed at giving new players a place to start with understanding their performance, while still providing useful information for more experienced players.

This checklist shows that the player did will on brew generation and Purifying Brew usage, with a little room for improvement on Ironskin Brew usage (which can be expanded for details using the down-arrow). Their use of damaging abilities leaves a bit to be desired, however.

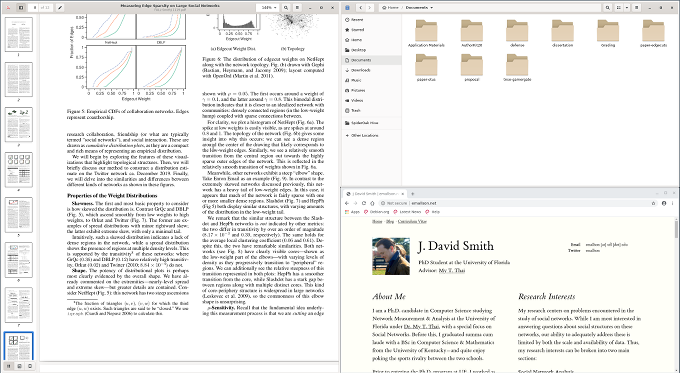
A sample view of the "tall" layout, which places one window at full height (left) and the remainder in a series of rows in the remaining column.

In Gram, this is done by composing the columns layout with the rows layout.

Gram — Tiling Window Manager

I have been a user of tiling window managers on Linux systems for over a decade, and decided to try my hand at writing one with the maturation of the Wayland backend. A tiling window manager differs from manual window management as done in most desktop environments in that it aims to automatically places windows in a structured manner.

The core is implemented in C, building on the wlc compositing library. It exposes the windowing primitives to Guile Scheme, where the main window management logic is implemented. A key feature I implemented was layout composition, which allows layout functions to be composed to create more complex layouts dynamically.